Data analysis is the process of inspecting, cleansing, transforming, and modeling data with the goal of discovering useful information. However, without proper data analysis, you may draw the wrong conclusion.
Without perspective, you may think things are going really poorly, when in reality, they are not; or the reverse may be true. You need both proper data analysis and proper perspective to make informed decisions for your business. One closeout is an observation, two is a line, and three closeouts create a trend. It is difficult to make decisions without context for what is good or bad.
Take a look at this graph of average daily gain (ADG). Having access to your own historical information is valuable, as you can evaluate your performance over time. Comparing within a site or a flow can certainly be helpful, but without perspective on how similar operations are performing, you are missing a crucial piece of the puzzle.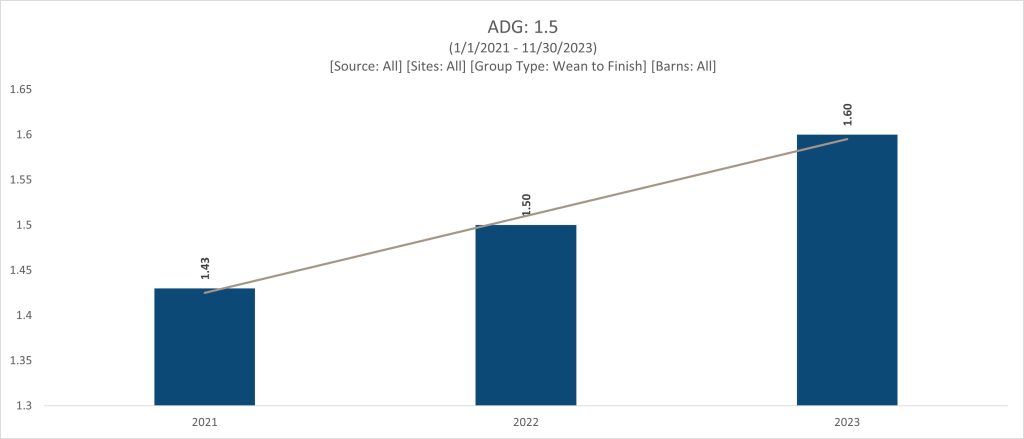
This improvement in ADG is laudable, but when looking at a larger benchmark (below), it shows that this producer still has a long way to go to be competitive. 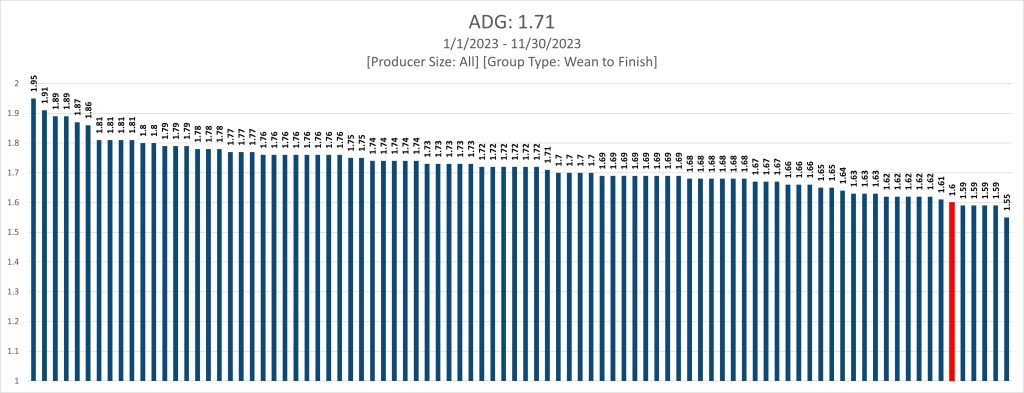
Without the perspective of the other benchmarks, this producer might be content with the improvement and quit striving and reaching; when they need to continue to make gain a focus.
Being able to interpret data, and making sure to look within genetics, time periods, and health status gives a more accurate picture of potential causes and focus areas for improvement. Trying to compare groups with different health statuses can lead to incorrect conclusions.
For example, if you looked at the data below, I’m sure you would choose Sire Line A, but this doesn’t tell you if Sire Line B suffered from more downstream PRRS breaks.
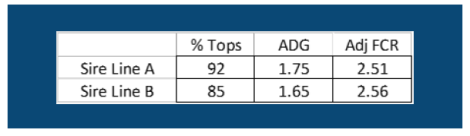
Additionally, you have to make sure that you have enough data to figure out if the difference is ‘real’ or just chance. Sometimes numerical differences are still economically important, but that is where you need a full picture of the data being analyzed before drawing conclusions.
With our FarmStats database, we have enough pigs and groups (3.7 million pigs in 2023) to allow for some really robust data analysis. But, for that next level of insight, and to determine if numerical differences are valid, we need to make sure we have a good perspective of the system being analyzed.
Are barns stocked at the same densities? Do they have the same feeder type? Are they fed different levels of fat or energy? Without that additional information, we cannot provide the additional insight that can help take your operation to the next level.
I encourage you to have conversations with any consultant you are working with and share as much as possible about your operation. More data can lead to more information to help you make better informed decisions. With current market conditions, maintaining your perspective, and making smart economic decisions are more important than ever.
 Article by Carrie Pollard
Carrie Pollard grew up on a 200-sow farrow-to-finish farm in western Illinois. She has a B.S. and M.S. in Animal Science from the University of Illinois and spent considerable time on notable wean-to-finish research projects. She joined PIPESTONE in 2017 and currently serves as a Senior Data Analyst for FarmStats.